Weekly Update: When to Sit on the Sidelines

This past Thursday, the market saw some wild back-and-forth volatility following the release of the latest consumer price index (CPI) reading.
The data showed the headline inflation reading gained by an annual pace of 8.2% in September, while the core inflation reading came in at 6.6%.
It was interesting to see that the market ended higher that day, even as the hotter-than-expected inflation reading likely means that the Federal Reserve will continue to hike interest rates aggressively.
But as short-term traders, there’s something specific we can learn from last week’s volatility that should be helpful for all Tunnel Traders going forward…
Join Us Tomorrow
Before we get to all of the details, I want to personally invite you to a special live presentation tomorrow at noon with my colleague and expert stock trader Ross Givens.
Ross’s premium Insider Effect research service focuses on corporate insider buying.
These insiders are corporate CEOs, CFOs, executives and board members either purchasing or selling shares in their own companies.
These folks have a footing of knowledge that Main Street investors simply do not.
In the live session, Ross will cover his strategy for swing trading alongside corporate insiders and generating potentially massive gains as a result.
You can register for the exclusive live session by clicking right here!
Now, let’s cover the markets we’re watching this week…
As of today, Oct. 17, we are currently looking for opportunities in the following markets:
Nasdaq 100 Futures
The NQ monthly time frame is in a short term down trend. The market is making lower lows and lower highs. The market broke and closed below a strong support level which promotes a continued bearish push. There is a down Fibonacci with an extension price point 7,546.50, about -15,510 ticks below the market. As long as the market stays below the short term down trend line, it will be a good idea to turn to the daily time frame and to look for high prices in the sell zone.
The NQ daily time frame is in a down channel. The market hit the top of the channel and is now pushing bearish towards the bottom of the channel. There is a down Fibonacci with an extension price point 9,595.25, about -5,496 ticks below the market. The market just formed a low price and is showing signs of having a short term bullish pull back towards the down trend line. It will be a good idea to wait for the daily time frame to form a high price near the down trend line before looking for selling ideas off the smaller time frame.
The NQ one hour time frame is in a sideways range. The market is moving from the top of the range towards the bottom of the range.
- Entry: Counter trend line break bearish near the top of the range or below the sideway range.
- Stop: In the buy zone above the entry.
- Limit: If entry is at the top of the sideways range, the limit is the bottom of the range. If the entry is below the sideways range, the limit is 9,595.25.
Once or if the market provides the one hour entry, it will be a good idea to turn to the five minute time frame and to look for Tunnel Trader short ideas towards the price target.
Russell 2000 Futures
The RTY monthly time frame has entered into a small sideways range just above the back side of the old down trend line. The market is just above support which could push the market back up towards resistance price point 1,905.00, about +1,586 ticks above the market. It will be a good idea to turn to the daily time frame to look for a bullish trend with a low price in the buy zone.
The RTY daily time frame is in a consolidation range. The market hit the bottom of the range and had a bullish push. The market broke and closed above a counter trend line bullish giving signs a bullish trend could form to the top of the range. As long as the market stays above the daily support, it will be a good idea to turn to the one hour time frame and to look for low prices in the buy zone towards 1,905.00, the monthly future resistance about +1,986 ticks above the market.
The RTY one hour time frame is in an up trend. The market is making higher highs and higher lows. The market has an up Fibonacci extension price point 1,776.90, about +857 ticks above the market.
- Entry: Counter trend line break bullish in the buy zone.
- Stop: 1,652.70
- Limit: 1,776.90
Once or if the market provides the one hour entry, and as long as the market stays in the buy zone, it will be a good idea to turn to the five minute time frame and to look for Tunnel Trader long ideas towards the one hour price target.
Crude Oil Futures
The CL monthly time frame is in an up channel. The market is near the bottom of the channel showing signs of pushing bullish towards the top of the channel price point 147.27, about +6,355 ticks above the market. It will be a good idea to turn to the daily time frame and to look for low prices in the buy zone.
The CL daily time frame hit the long term up trend line and pushed bullish. The market has broken and closed above the short term down trend line and has entered into the buy zone. The market has yet to wave, so it is expected the market to continue to push bullish above the old down trend line and then pull back to form a low higher than the last low. When or if this happens, we can apply an up Fibonacci to the market to help find the next bullish target. Until then, it will be a good idea to turn to the one hour time frame and to look for low prices in the buy zone.
The CL one hour time frame is in an up trend. The market is making higher highs and higher lows. The market has an up Fibonacci with an extension price point 98.57, about +660 ticks above the market.
- Entry: Counter trend line break bullish in the buy zone.
- Stop: 85.16
- Limit: 98.57
As long as the market stays in the buy zone, it will be a good idea to turn to the five minute time frame and to look for Tunnel Trader long ideas towards the price target.
We are currently out of the following markets and waiting for entry opportunities:
S&P 500 Futures
The ES monthly time frame is in a short term down trend. The market is making lower lows and lower highs. The market closed below a strong support level which provides research to expect a continued bearish push. There is a down Fibonacci with an extension price point 3,026.00, about -2,743 ticks below the market. As long as the market stays below the short term down trend line, it will be a good idea to turn to the daily time frame and to look for a high price in the sell zone.
The ES daily time frame is in a down channel. The market hit the top of the channel and is now pushing bearish making lower lows and lower highs towards the bottom of the channel. There is a down Fibonacci extension price point 3,199.00, about -2,211 ticks below the market. The market is currently moving from a low price towards a high price (ideally near the down trend line).
It will be a good idea to wait for the market to finish pulling back and give a high price before turning to the smaller time frames and looking for selling ideas.
BTC Futures
The BTC monthly time frame is in a long term bullish trend. The market is moving from a high price towards a future low price. The market has a down Gartley Fibonacci extension price point 10,300.00 which is near the up trend line. If the market hits the down Gartley Fibonacci extension, it is expected a bullish U-turn towards 76,555 which is the monthly up Fibonacci extension. It will be a good idea to turn to the daily time frame and to wait for the market to break the down daily trend line before looking for long ideas.
The BTC daily time frame is in a down trend. The market is making lower lows and lower highs. There is a down Fibonacci extension below the market price point 11,060.00, about -1,629 ticks below the market.
I am out of the market waiting for the market to hit the down Fibonacci extension. Then, I will look for the bullish reversal towards the monthly Fibonacci extension.
Performance Spotlight
With inflation still at the top of the list of what markets care about most, expect to see more volatility following economic data releases like future CPI readings.
As traders, we’re happy to embrace this type of volatility.
But sometimes it can be better to use the Tunnel Trader strategies leading up to an announcement rather than after the news has come out.
Just take a look at last week’s action, for example…
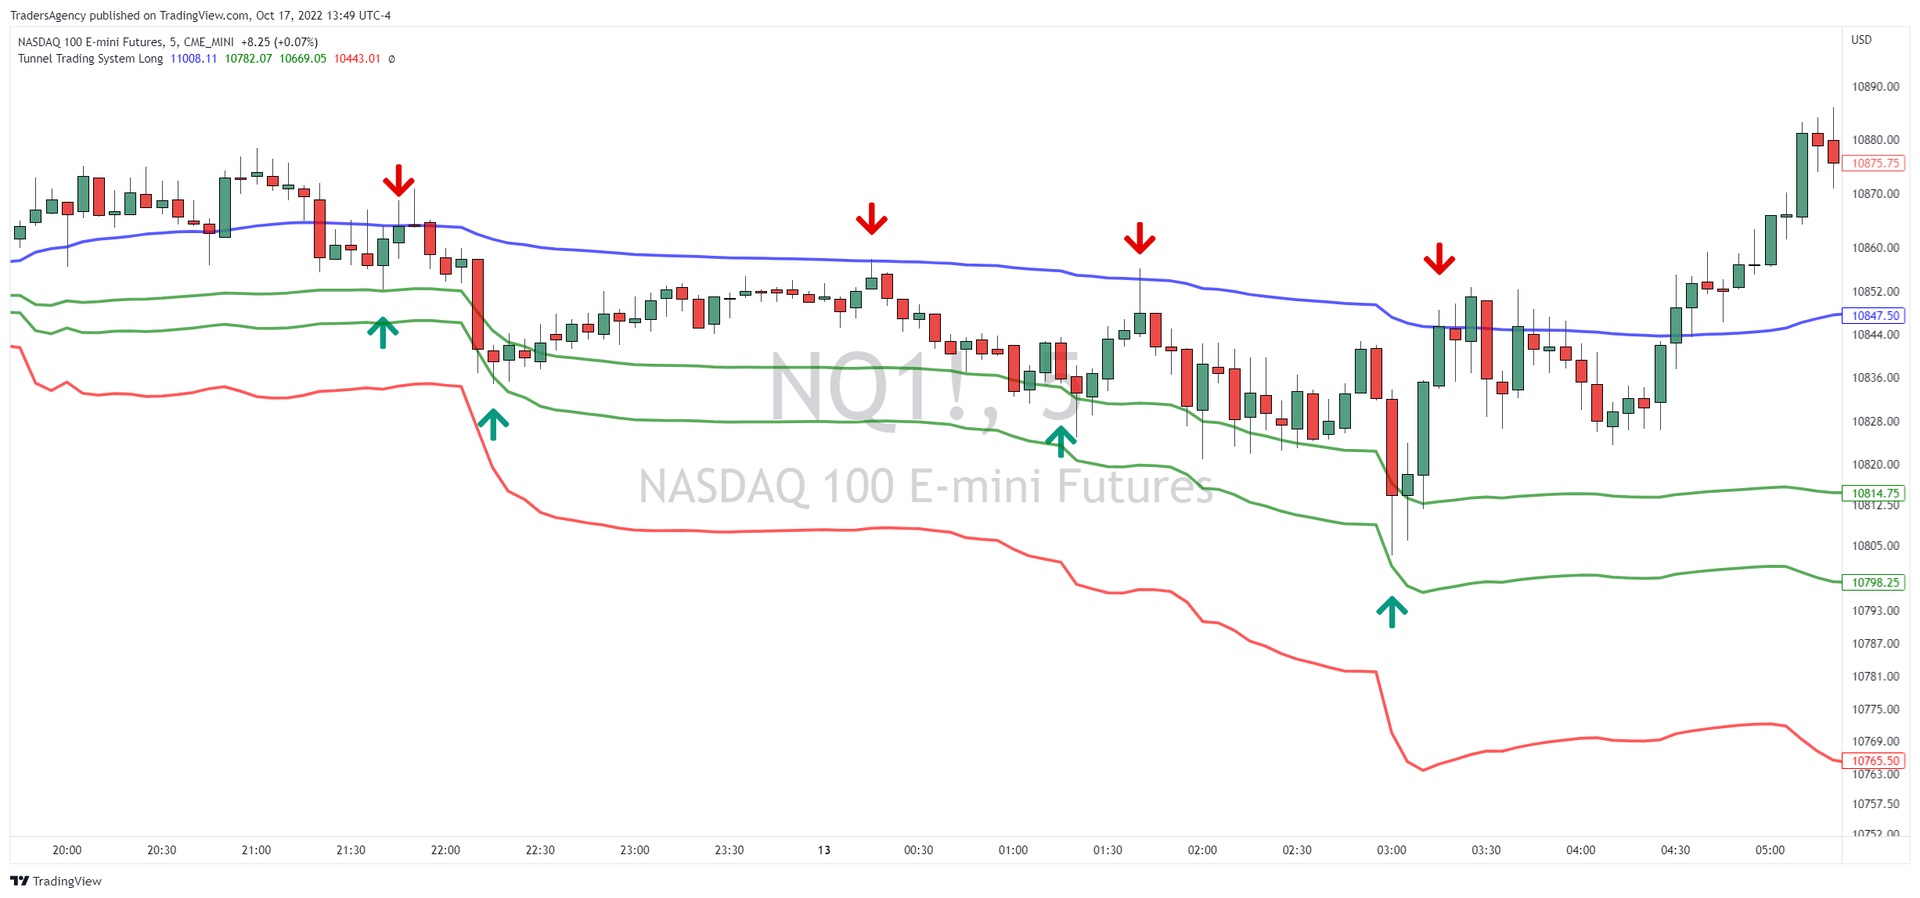
The five-minute chart of Nasdaq 100 (NQ) futures above shows the market action during the early hours of Thursday’s session.
You can see that there were numerous opportunities on the long side as the markets largely were quiet ahead of the CPI release.
The Tunnel Trader lines were relatively steady, making it an easier environment to find short-term ideas.
But now, take a look at what happened to those same lines after the CPI reading was released…

As the market posted a big, five-minute down candlestick, the Tunnel Trader lines expanded quickly with the increase in volatility.
For the remainder of the day, the market rallied above the blue and green Tunnel Trader lines without providing any entry opportunities.
A wide range between the green and blue lines can sometimes make for higher-than-average profit potential.
But in an extreme case like this, with the red stop line so far below the market, it increases far too much potential risk to trade intraday.
Remember, we only want to trade when the odds are in our favor, and sometimes that means not using the Tunnel Trader system during big economic events.
Before You Go…
Did you miss our special Support & Resistance Bootcamp session last month?
If so, don’t worry… The recording is available on our website right here!
For more on all of the markets and how to best utilize our Tunnel Trader strategies, view all of our Q&A Session Recordings on this page.
Need help with our software? Sign up for an Orientation Class! Wondering which broker to choose? Start your search right here!
For everything else, visit our main course page right here.
Keep on trading,

Josh Martinez
Editor, Tunnel Trading Course
P.S. Ross Givens is in the know about insider trading in stocks set to soar as company insiders are buying.
And he’s holding a special session to reveal his secret Insider Effect trading formula tomorrow at noon. Click here to register now!