Weekly Update: How Much Are You Willing to Risk?

Regular readers know that we rely on monthly and daily time frame charts to make educated forecasts about where the market will possibly move next.
Sometimes, the various time frames don’t align with one another… The monthly might be in an up trend, while the daily is pointing lower, for example.
But when all of the time frame charts are aligned, things become much easier.
In fact, there’s just one question you need to ask yourself when the monthly and daily time frames are pointing in the same direction…
That question is, “How much are you willing to risk?”
Join Us Tomorrow
Before we get to all of the details, I want to personally invite you to a special live presentation tomorrow at noon with my colleague and expert stock trader Ross Givens.
Ross’s premium Insider Effect research service focuses on corporate insider buying.
These insiders are corporate CEOs, CFOs, executives and board members either purchasing or selling shares in their own companies.
These folks have a footing of knowledge that Main Street investors simply do not.
In the live session, Ross will cover his strategy for swing trading alongside corporate insiders and generating potentially massive gains as a result.
You can register for the exclusive live session by clicking right here!
Now, let’s cover the markets we’re watching this week…
As of today, Oct. 10, we are currently looking for opportunities in the following markets:
Nasdaq 100 Futures
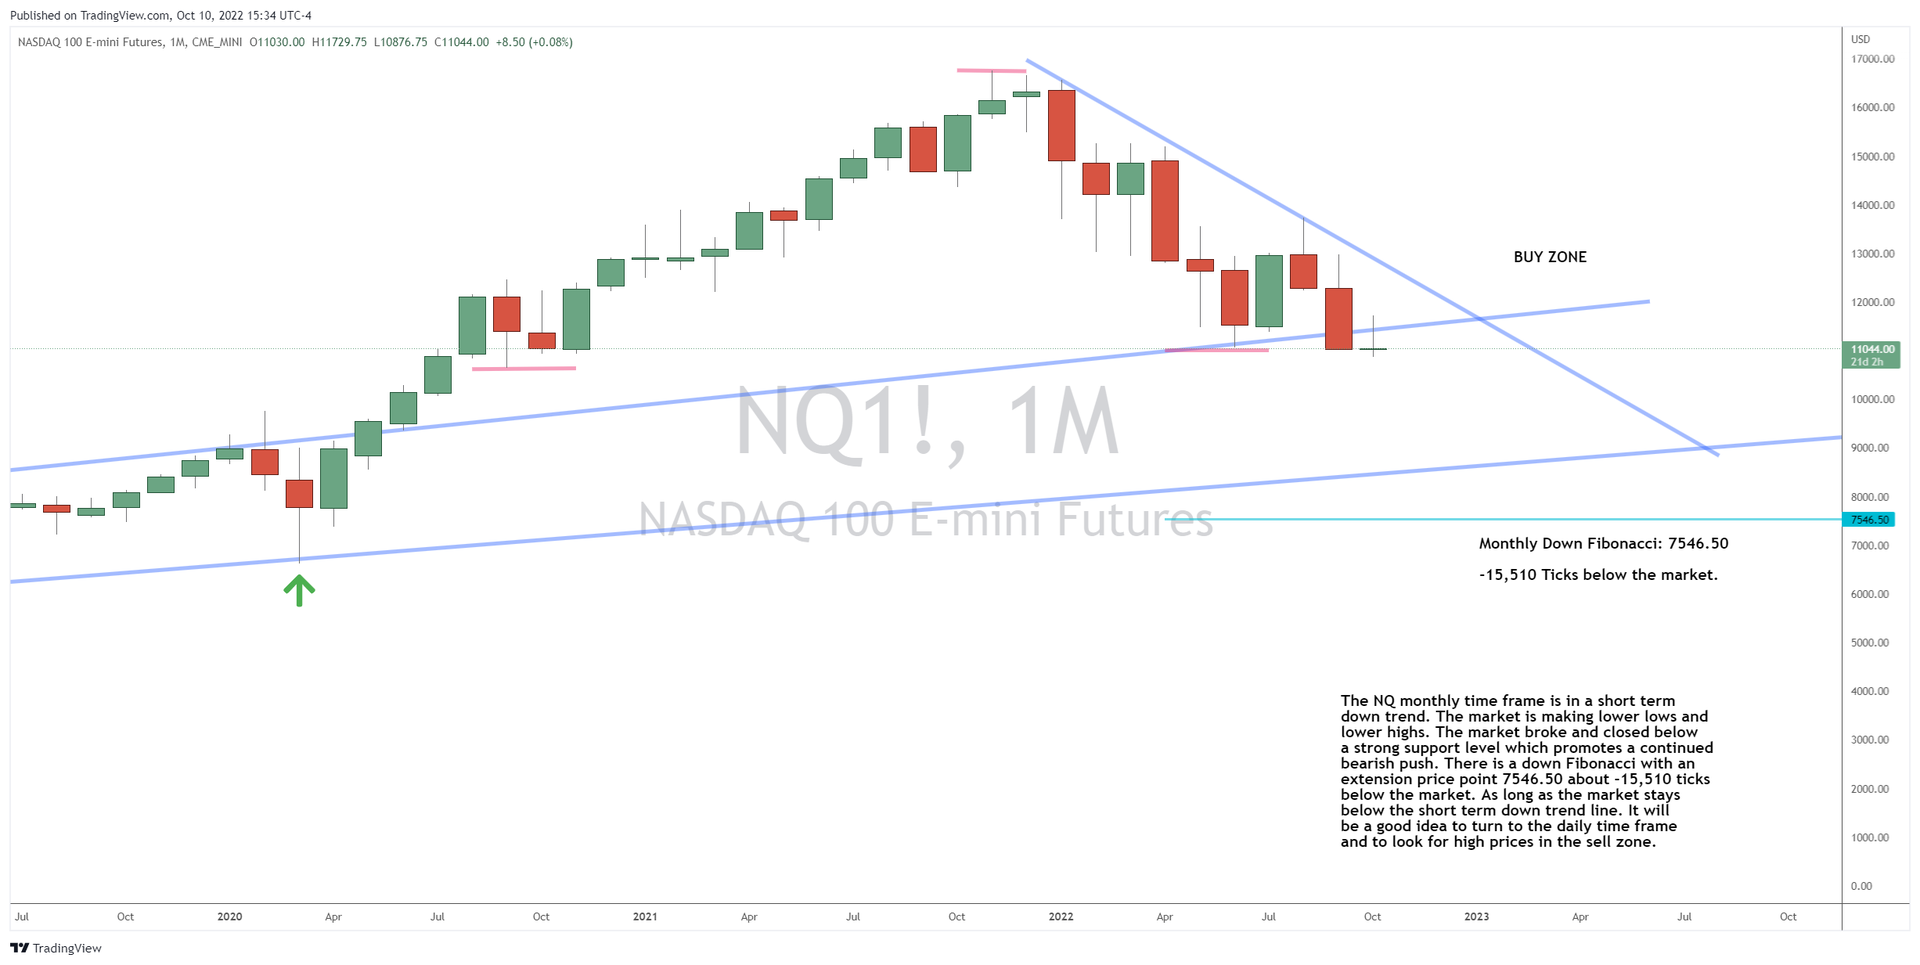
The NQ monthly time frame is in a short term down trend. The market is making lower lows and lower highs. The market broke and closed below a strong support level which promotes a continued bearish push. There is a down Fibonacci with an extension price point 7,546.50 about -15,510 ticks below the market. As long as the market stays below the short term down trend line, it will be a good idea to turn to the daily time frame and to look for high prices in the sell zone.
The NQ daily time frame is in a down channel. The market hit the top of the channel and is now pushing bearish towards the bottom of the channel. There is a down Fibonacci with an extension price point 9,595.25 about -5,496 ticks below the market. The market just formed a low price and is showing signs of having a short term bullish pull back towards the down trend line. It will be a good idea to wait for the daily time frame to form a high price near the down trend line before looking for selling ideas off the smaller time frame.
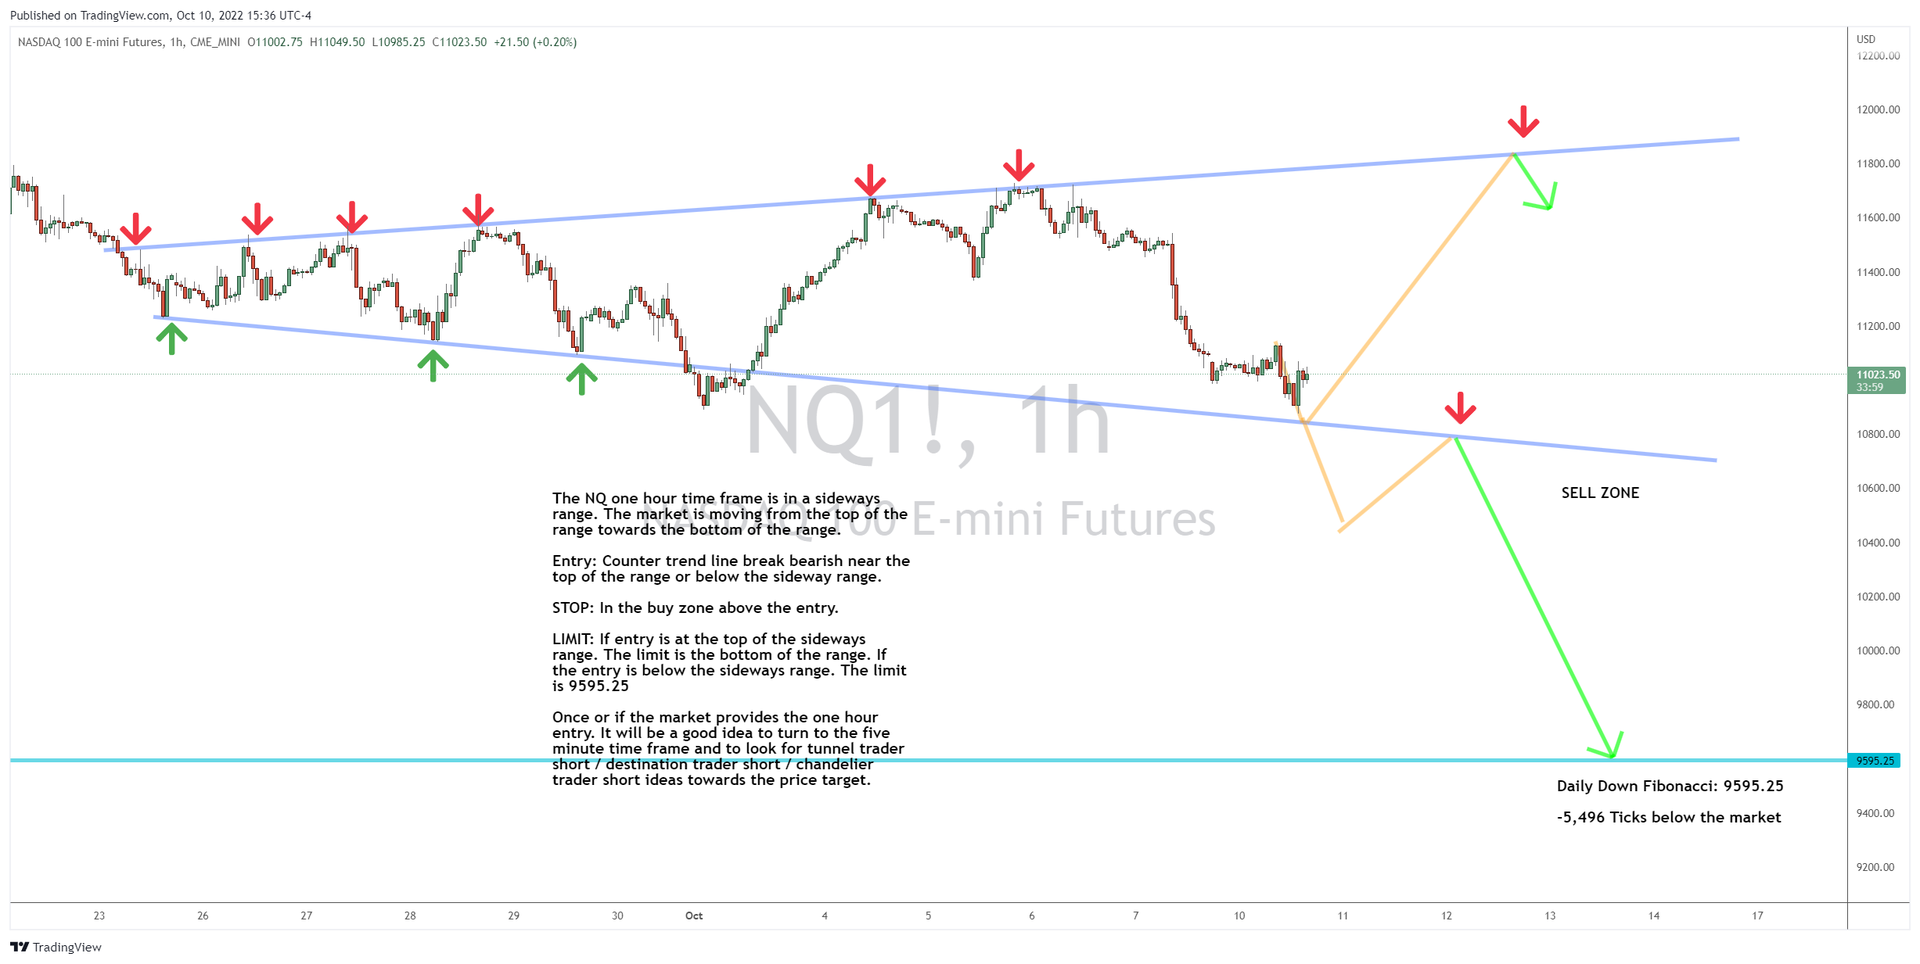
The NQ one hour time frame is in a sideways range. The market is moving from the top of the range towards the bottom of the range.
- Entry: Counter trend line break bearish near the top of the range or below the sideway range.
- Stop: In the buy zone above the entry.
- Limit: If entry is at the top of the sideways range, the limit is the bottom of the range. If the entry is below the sideways range, the limit is 9,595.25.
Once or if the market provides the one hour entry, it will be a good idea to turn to the five minute time frame and to look for Tunnel Trader short ideas towards the price target.
Russell 2000 Futures
The RTY monthly time frame has entered into a small sideways range just above the back side of the old down trend line. The market is just above support which could push the market back up towards resistance price point 1,905.00 about +1,586 ticks above the market. It will be a good idea to turn to the daily time frame to look for a bullish trend with a low price in the buy zone.
The RTY daily time frame is in a consolidation range. The market hit the bottom of the range and had a bullish push. The market broke and closed above a counter trend line bullish giving signs a bullish trend could form to the top of the range. As long as the market stays above the daily support, it will be a good idea to turn to the one hour time frame and to look for low prices in the buy zone towards 1,905.00, the monthly future resistance about +1,986 ticks above the market.
The RTY one hour time frame is in an up trend. The market is making higher highs and higher lows. The market has an up Fibonacci extension price point 1,809.80 about +724 ticks above the market.
- Entry: Counter trend line break bullish in the buy zone.
- Stop: 1,652.70
- Limit: 1,809.80
Once or if the market provides the one hour entry, and as long as the market stays in the buy zone, it will be a good idea to turn to the five minute time frame and to look for Tunnel Trader long ideas towards the one hour price target.
Crude Oil Futures
The CL monthly time frame is in an up channel. The market is near the bottom of the channel showing signs of pushing bullish towards the top of the channel price point 147.27 about +6,355 ticks above the market. It will be a good idea to turn to the daily time frame and to look for low prices in the buy zone.
The CL daily time frame hit the long term up trend line and pushed bullish. The market has broken and closed above the short term down trend line and has entered into the buy zone. The market has yet to wave, so it is expected the market will to continue to push bullish above the old down trend line and then pull back to form a low higher than the last low. When or if this happens, we can apply an up Fibonacci to the market to help find the next bullish target. Until then, it will be a good idea to turn to the one hour time frame and to look for low prices in the buy zone.
The CL one hour time frame is in an up trend. The market is making higher highs and higher lows. The market has an up Fibonacci with an extension price point 98.57, about +660 ticks above the market.
- Entry: Counter trend line break bullish in the buy zone.
- Stop: 85.16
- Limit: 98.57
As long as the market stays in the buy zone, it will be a good idea to turn to the five minute time frame and to look for Tunnel Trader long ideas towards the price target.
We are currently out of the following markets and waiting for entry opportunities:
S&P 500 Futures
The ES monthly time frame is in a short term down trend. The market is making lower lows and lower highs. The market closed below a strong support level which provides research to expect a continued bearish push. There is a down Fibonacci with an extension price point 3,026.00 about -2,743 ticks below the market. As long as the market stays below the short term down trend line, it will be a good idea to turn to the daily time frame and to look for a high price in the sell zone.
The ES daily time frame is in a down channel. The market hit the top of the channel and is now pushing bearish making lower lows and lower highs towards the bottom of the channel. There is a down Fibonacci extension price point 3,199.00 about -2,211 ticks below the market. The market is currently moving from a low price towards a high price (ideally near the down trend line).
It will be a good idea to wait for the market to finish pulling back and give a high price before turning to the smaller time frames and looking for selling ideas.
BTC Futures
The BTC monthly time frame is in a long term bullish trend. The market is moving from a high price towards a future low price. The market has a down Gartley Fibonacci extension price point 10,300 which is near the up trend line. If the market hits the down Gartley Fibonacci extension, it is expected we’ll see a bullish U-turn towards 76,555 which is the monthly up Fibonacci extension. It will be a good idea to turn to the daily time frame and to wait for the market to break the down daily trend line before looking for long ideas.
The BTC daily time frame is in a down trend. The market is making lower lows and lower highs. There is a down Fibonacci extension below the market price point 11,060 about -1,629 ticks below the market.
I am out of the market waiting for the market to hit the down Fibonacci extension. Then, I will look for the bullish reversal towards the monthly Fibonacci extension.
Performance Spotlight
“How much are you willing to risk?”
That’s the question you must ask yourself when a market’s monthly and daily time frame charts are all aligned in the same direction.
Right now, one of the markets that is fully aligned (to the downside) is the Nasdaq 100.
In the chart below, you can see that the monthly time frame closed in the sell zone last month, which promotes a continued bearish push.
The daily chart is also pointing lower and is still trading below its short term down trend line, which is a known level of U-turn…

Therefore, when we make our way to the hourly chart, we should be looking for selling ideas…
However, the hourly chart is currently in a sideways range. That means that there are a few ways a trader could go about looking for selling ideas…
Take It Easy or Get Aggressive?
A conservative approach to selling the NQ at this point would be to wait for a bounce to a high price at the top of the hourly range.
As represented by the red down arrows on the chart above, the top of the sideways range is a known level of U-turn.
If the market gets back up there, a trader could use a counter trend line break bearish to trade the NQ back towards the bottom of the channel.
The other way a conservative trader could look to sell the NQ right now would be to watch for a break below the bottom of the sideways range.
If the market breaks below the bottom of the range, a trader could use a counter trend line break bearish to trade the NQ down towards the daily down Fibonacci at 9,595.25.
The aggressive approach, however, would be to simply sell the NQ right now and look for a move towards that same daily down Fibonacci.
Define Your Risk
As Tunnel Traders, we recommend a conservative approach, as outlined in the hourly chart above.
However, it all comes back to the question posed earlier… “How much are you willing to risk?”
Sure, if you wait for a counter trend line break near the top of the range or below the bottom of the range, the research says you’ll have better odds of winning the trade…
But if the market just keeps moving lower from current levels, that opportunity may never develop and the trade never happens.
On the other hand, an aggressive trader could choose to enter the market now and have a better chance of catching the next leg lower…
But they would take on the additional risk of potentially having the market go higher before it goes lower.
In other words, the aggressive trader may have to sit through a drawdown as the market returns to the top of the range before the position eventually moves in the expected direction.
As you can see, there are tradeoffs to both scenarios, so it all comes down to managing your entries and determining how much risk you are willing to take.
Before You Go…
Did you miss our special Support & Resistance Bootcamp session last month?
If so, don’t worry… The recording is available on our website right here!
For more on all of the markets and how to best utilize our Tunnel Trader strategies, view all of our Q&A Session Recordings on this page.
Need help with our software? Sign up for an Orientation Class for Ninja Trader 8 or TradingView & TradeStation.
Wondering which broker to choose? Start your search right here.
For everything else, visit our main course page right here.
Keep on trading,

Josh Martinez
Editor, Tunnel Trading Course
P.S. Ross Givens is in the know about insider trading in stocks set to soar as company insiders are buying.
And he’s holding a special session to reveal his secret Insider Effect trading formula tomorrow at noon. Click here to register now!