Weekly Update: A Cliffhanger Moment for the Market
The month of September came to a close last Friday, solidifying another set of tall, red candlesticks across our monthly charts.
The S&P 500 (ES) lost 9%, the Nasdaq 100 (NQ) fell 10.2% and the Russell 2000 (RTY) dropped 9.5%.
But with another month in the books, what do the monthly charts tell us about the market’s long-term direction?
Unfortunately, not as much as we’d like…
Join Us Tomorrow
Before we get to all the details, if you are looking for a way to potentially supercharge your weekly trading gains…
Be sure to check out the latest strategy presentation from my colleague and expert trader Ross Givens tomorrow afternoon.
His new “rapid cash” strategy works just as well in an up market as it does in a down market.
It’s totally market neutral, so it doesn’t matter if a stock goes up or goes down…
With this strategy, Ross can set up his trades to win in either direction.
And since each trade is opened on a Monday and closed out by Friday, your exposure to this wild market is limited…
Now, let’s cover the markets we’re watching this week…
As of today, Oct. 3, we are currently looking for opportunities in the following markets:
S&P 500 Futures
The ES monthly time frame broke a major level of support and entered into the sell zone. After entering into the sell zone, the market pushed bullish right back into the buy zone. This is a sign of sideways movement or the sellers and the buyers fighting for control. It will be a good idea to turn to the daily time frame and to look for a trend. Either bullish or bearish to help decide who is in control.
The ES daily time frame is in a down channel. The market hit the top of the channel and is now pushing bearish towards the bottom of the channel. There is a down Fibonacci with an extension price point 3,609.00 about -410 ticks below the market. It will be a good idea to turn to the one hour time frame and to look for high prices in the sell zone.
The ES one hour time frame is in a down trend making lower lows and lower highs. The market has a down Fibonacci extension below the market price point 3,634.25 about -317 ticks below the market.
- Entry: Counter trend line break bearish near the down trend line.
- Stop: In the buy zone above the entry.
- Limit: 3,634.25
Once or if the market gives the entry and as long as the market stays in the sell zone, it will be a good idea to turn to the five minute time frame and to look for Tunnel Trader short ideas towards the price target.
We are currently out of the following markets and waiting for entry opportunities:
Nasdaq 100 Futures
The NQ monthly time frame is in an up trend. The market is making higher highs and higher lows. The market has an up Fibonacci with an extension above the market at price point 17,867.50 about +22,860 ticks away. The market is at a low price hitting a known level of support. If support fails, it is expected the market will fall bearish towards the next level of support price point 8,646.75 about -14,163 ticks below the market. It will be a good idea to turn to the daily time frame and look for a bullish or bearish trend to give the direction.
The NQ daily time frame is in a down channel. The market is making lower lows and lower highs. The market has hit a down Fibonacci extension price point 11,571.00 but has yet to form a low price. It will be a good idea to stay out of the market until the market pulls back and forms a high price giving the opportunity to look for the next short.
At this time, it is better to be out of the market wishing to be in, than to be in the market wishing to be out.
Russell 2000 Futures
The RTY monthly time frame has entered into a small sideways range just above the back side of the old down trend line. The market is just above support, which could push the market back up towards resistance price point 1,905.00 about +2,045 ticks above the market. It will be a good idea to turn to the daily time frame to look for a bullish trend with a low price in the buy zone.
The RTY daily time frame is in a sideways range. The market is near the bottom of support. It will be a good idea to stay out of the market until the market either A) support holds and a bullish trend forms to push the market back towards resistance price point 1,905 or B) the market breaks below support and a bearish trend forms. If a bearish trend forms, we can use a down Fibonacci to find the limit.
At this time, it is better to be out of the market waiting for the entry signal versus to be in the market guessing the direction.
BTC Futures
The BTC monthly time frame is in a long term bullish trend. The market is moving from a high price towards a future low price. The market has a down Gartley Fibonacci extension price point 10,300, which is near the up trend line. If the market hits the down Gartley Fibonacci extension, it is expected we’ll see a bullish U-turn towards 76,555, which is the monthly up Fibonacci extension. It will be a good idea to turn to the daily time frame and to wait for the market to break the down daily trend line before looking for long ideas.
The BTC daily time frame is in a down trend. The market is making lower lows and lower highs. There is a down Fibonacci extension below the market price point 11,060 about -1,629 ticks below the market.
I am out of the market waiting for the market to hit the down Fibonacci extension. Then, I will look for the bullish reversal towards the monthly Fibonacci extension.
Crude Oil Futures
The CL monthly time frame is in an up channel. The market is near the bottom of the channel showing signs of pushing bullish towards the top of the channel price point 147.27 about +6,355 ticks above the market. It will be a good idea to turn to the daily time frame and to look for low prices in the buy zone.
The CL daily time frame is in an up trend. The market is at a low price hitting the up trend line.
It will be a good idea to wait for the market to push bullish and close above the short term down trend line before looking for long ideas off the one hour time frame.
Performance Spotlight
As the new month begins, I want to reexamine our multi-time frame analysis approach, which basically boils down to gathering different pieces of information by looking at different market time frames.
For example, we typically find market direction by looking at the monthly charts, and we figure out when markets are in the buy zone or sell zone by looking at the daily charts.
But in certain situations, like right now, the monthly time frame isn’t always helpful. For example, take a look at the monthly chart of the Nasdaq 100 (NQ) below…
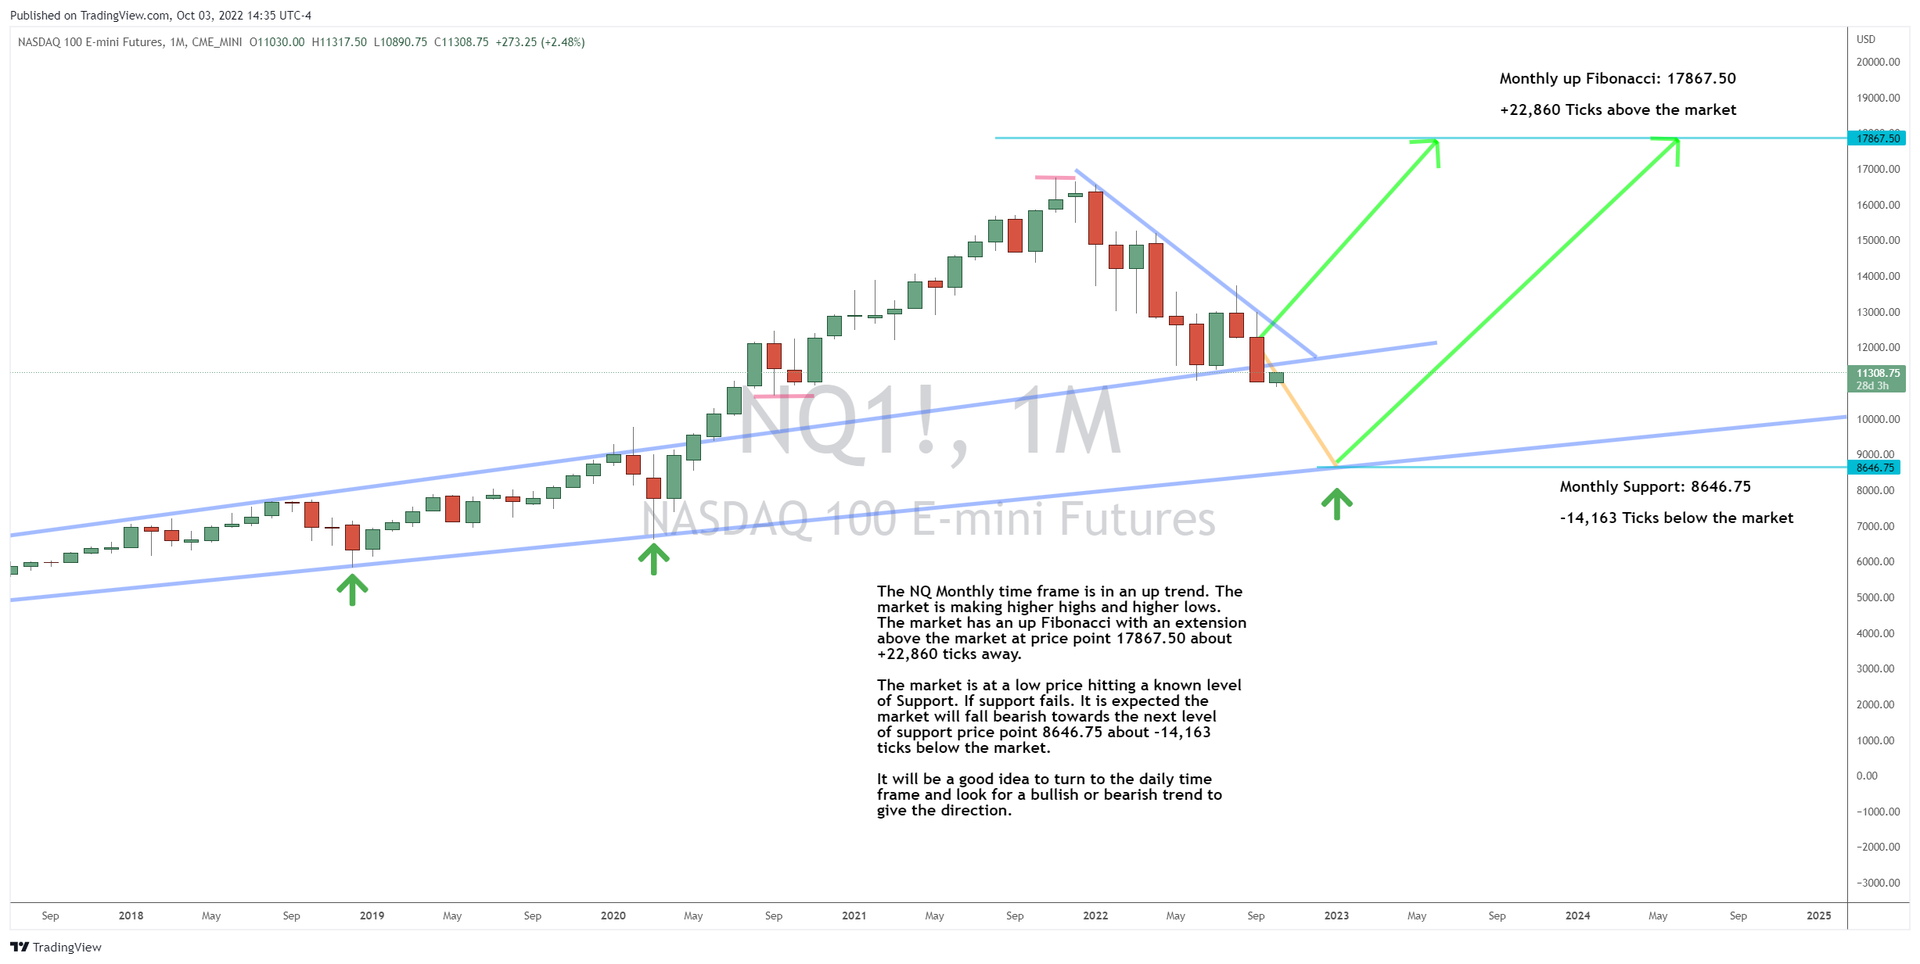
As you can see, the monthly chart just closed September’s candle below the top of the up channel, which was a key support level.
However, the issue is that we’re only one day into October’s monthly candlestick, so we don’t have a full month’s worth of data right now.
The market could turn higher this month and close above support, or it could continue lower and close below support again…
We just don’t know yet, and we won’t know until the end of the month.
Therefore, the monthly chart is not of much use to us right now in terms of finding market direction.
Turn to the Daily
So, what can we do about this? Well, we have to turn to the lower-level time frames.
That means turning to the daily time frame, which we typically use to determine whether the market is in the buy zone or the sell zone.

In the daily NQ chart above, you can see that the market is currently in a down channel and has hit the daily down Fibonacci at 11,571.
Now that the down Fibonacci extension was hit, the market could either push bullish back towards resistance at the top of the channel or continue to sell off towards future support at the bottom of the channel.
But at this point, betting on a move in either direction would carry too much risk, so we feel it is better to be out of the market wishing to be in, than to be in the market wishing to be out.
Normally, we’d be able to look at the monthly time frame, learn the overall direction and make an educated decision about where we think the market will head next.
But with the monthly time frame at an indecision point, we are still playing what I call the “buy zone, sell zone” game.
Stay Short Term
What I mean by that is that we can’t commit to any long-term approaches right now.
Instead, we can only rely on the daily chart to determine whether the market is in the buy zone or sell zone.
And in turn, that means that we will be favoring short-term day trades over longer-term swing trades.
With the longer-term time frame not giving us any useful information, we shouldn’t be using a long-term trading strategy.
We have no choice but to turn to the shorter-term time frame analysis, which means using a short-term trading strategy is going to be the best path forward in a market like this.
Before You Go…
Did you miss our special Support & Resistance Bootcamp session last month?
If so, don’t worry… The recording is available on our website right here!
For more on all of the markets and how to best utilize our Tunnel Trader strategies, view all of our Q&A Session Recordings on this page.
Need help with our software? Sign up for an Orientation Class for Ninja Trader 8 or TradingView & TradeStation.
Wondering which broker to choose? Start your search right here.
For everything else, visit our main course page right here.
Keep on trading,

Josh Martinez
Editor, Tunnel Trading Course
P.S. Click here to register for Ross’s FREE, urgent broadcast right here.